The following questions are addressed in this article:
What is the Usage tool?
How can I access the Usage area in my project’s group?
What data does the Usage tool show?
How can I export the data from the Usage tool?
What is the Usage tool?
The Usage tool is one of several community features available within groups on QUBESHub. The Usage tool tracks website traffic to group pages and other community actions, such as the number of Resources, Blog Entries, and Membership Approvals.
How can I access the Usage area in my project’s group?
What data does the Usage tool show?
In addition to tracking various community actions, the Usage tool shows the number of pageviews and unique visitors for your group pages. Pageviews is the number of visits (that is, the number of page loads). Unique Visitors is the number of unique visitors based on IP address. For example, if a single IP address visits a particular page 27 times, it would be counted as 27 pageviews and 1 unique visitor. It’s worth noting that some institutions are behind a firewall that has only 1 IP address. Therefore, the number of Unique visitors is always an underestimate.

You can view the number of pageviews and unique visitors for all of your group pages or select a page from the Count drop down menu to view the data for that page. “All Page” counts visits to any of the group pages. For example, if a Unique Visitor visits the “Overview” page, then the “About” page, then the “How To Join” page (these are just hypothetical page examples), it would be shown in the "All Page" graph as 1 Unique Visitor and 3 Pageviews for that day.
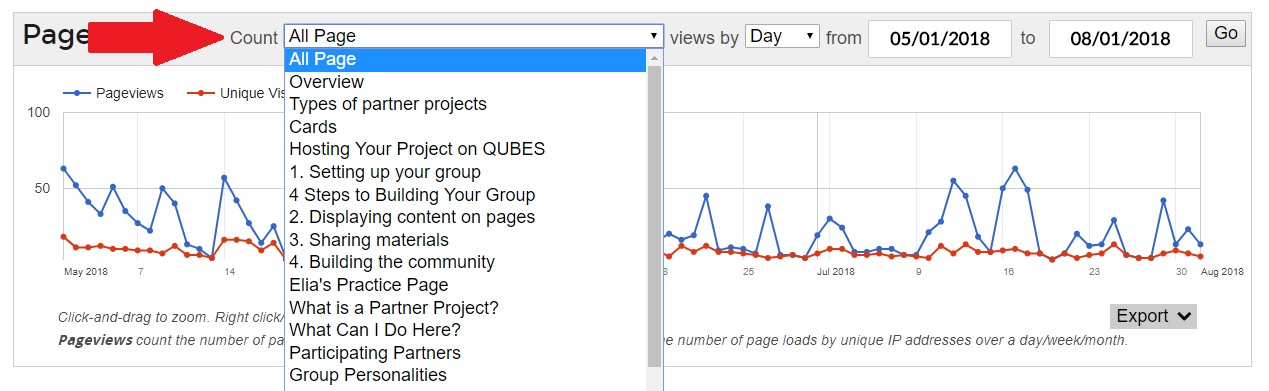
The data can be viewed by day, by week, or by month. For example, if a Unique Visitor visited a page one time on each of 5 separate days in a week, it would be counted by day as 1 Unique Visitor and 1 Pageview on each of those 5 days, but it would be collapsed to 1 Unique Visitor and 5 Pageviews when counted by week or month.

You can adjust the range of dates shown in the graph.

Remember to click Go to update the graph.

To explore the plot, you can also click-and-drag to zoom in on a particular portion of the graph. Right-click/Ctrl-click will reset the plot.


How can I export the data from the Usage tool?
The Export button that allows you to export the data for the plot as a CSV file, a PNG image, and an SVG image.
