Each Community Spotlight features an outstanding group, partner, resource, or member of our community.

Statistical Exploration of Climate Data (Version 1.0)

By Tamra Carpenter, Jon Kettenring, and Robert Vanderbei

Local Warming Results Map

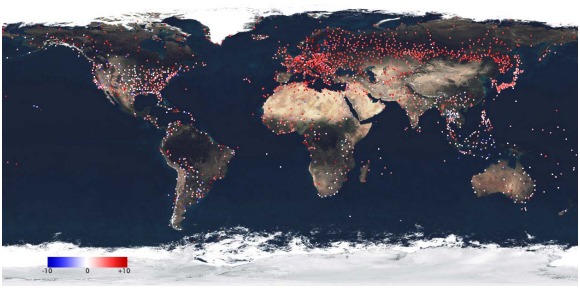
Image from R. J. Vanderbei, “Local Warming”, SIAM Review, 54(3), pp. 597-606, 2012.  Available on-line,
http://www.princeton.edu/~rvdb/tex/LocalWarming/LocalWarmingSIREVrev.pdf.


Module Description:

In this module, students will learn some basic concepts in statistical thinking about data, with emphasis on exploratory data analysis. The module will analyze daily temperature data collected over 55 years at a single location – McGuire Air Force Base (AFB) in southern New Jersey. The analysis explores the question, “Is there any observable temperature trend over this time period at McGuire AFB?” The challenge is to see a potentially small change within a data set that has both seasonal variability and high daily variability. We will do basic plots to help the students view data in different ways, introduce methods for removing seasonality, and use averaging to reduce day-to-day variability.

This module might be viewed as a “case study” in data analysis. It will give students a taste of what it’s like to do “real world” data analysis. Students will work with a large noisy data set and look at it in different ways to try to answer a specific question. The module does not, however, provide an answer to the question on temperature change that it addresses – it is about the process of data analysis. Each individual analysis (corresponding to a figure in the module) leads us to a new set of questions, which in turn leads to further analyses. This is often the way data analysis proceeds in practice. As the adage goes, “It’s not the destination, it’s the journey.”

For instructors wanting students to interact with data, we provide the MATLAB code to generate each of the individual plots discussed in the text. Thus, the instructor can easily reproduce all studies in the module using MATLAB or reprogram the analyses for some other package.  Alternatively, instructors can use this module in the absence of software technology by using the plots generated in the text and discussing their features with the class.   


Teaching Setting:

This module was designed for introductory undergraduate statistics students or students in a first course on exploratory data analysis.    


QUBES Citation:

Carpenter, T., Kettenring, J., Vanderbei, R. (2018). Statistical Exploration of Climate Data. QUBES Educational Resources. doi:10.25334/Q4GH8W


Visit Resource


Share
Tweet


Related Materials and Opportunities:

This module is created in association with the Mathematics of Planet Earth project led by DIMACS (the Center for Discrete Mathematics and Theoretical Computer Science), which facilitates research, education, and outreach in discrete mathematics, computer science theory, algorithms, mathematical and statistical methods, and their applications.

This module can be implemented using MATLAB.  QUBES offers an open-source alternative to MATLAB, called QtOctave.  Users can launch QtOctave directly in their browser from the QtOctave page on QUBES.  This module could easily be adapted for use with QtOctave.  If you are interested in adapting this module for use with QtOctave or in other ways, begin by going to this resource’s full record and clicking on the green “Adapt” button on the right side of the page.  Then follow the additional instructions for posting a resource on QUBES.     

High school faculty and college faculty from two- and four-year institutions who use or are interested in using data in the classroom are invited to attend the 2019 QUBES/BioQUEST Summer Workshop, titled Evolution of Data in the Classroom: From Data to Data Science.  This workshop will be held at the College of William & Mary in Williamsburg, VA on July 14-19, 2019 and will focus on how data science practices can enhance biology education. Participants will work with colleagues to develop and adapt teaching materials that use data and quantitative skills to engage students with meaningful biological problems. We will consider which aspects of data science are most relevant to biology education, and how to incorporate these ideas in the existing curriculum. We will explore effective pedagogical approaches for incorporating data science in the classroom.  If you are interested in attending, we encourage you to sign up for updates here.

The 2019 workshop organizers are seeking four highly motivated future faculty volunteers who will help with the day to day logistics of the workshop in exchange for a registration fee waiver.  If you are interested in being a future faculty volunteer, learn more about the Future Faculty Program on the workshop website. Applications will open early 2019.


QUBES on Social Media
BioQUEST is a transformative, collaborative community empowering educators to drive innovation in STEM education for all students.
Copyright © 2024 QUBES, All rights reserved.
P.O. Box 1452, Raymond, NH 03077
You are receiving this email because you have shown interest in receiving updates from BioQUEST and QUBES.

Subscribe / Unsubscribe from mailing list
View Community Spotlight on QUBESHub
Community Spotlight: Issue 21